
Bitcoin holds near $76,670 while Hyperliquid steals the spotlight with a 23% weekly surge, XRP remains trapped below its 50-day moving average, and Shiba Inu drifts deeper into bearish territory. Across all four assets, the market on May 26 rewards selective risk-taking and punishes indecision.
The Crypto Fear & Greed Index sits at 34, firmly in "Fear" territory. Bitcoin dominance hovers around 60%, and total crypto market capitalization stands at roughly $2.58 trillion. Against that cautious backdrop, a three-tier market structure has emerged: BTC as a relatively stable anchor, large-cap altcoins struggling for traction, and a handful of high-conviction plays capturing outsized returns.
Bitcoin and XRP: Macro Leaders Setting the Tone
Bitcoin traded at $76,670 on May 26, down 0.81% over 24 hours, with a market cap of $1.535 trillion. BTC lost its short-term ascending trendline after failing to hold above local highs, and now faces the 200-day moving average at $81,000 as its most significant resistance zone of 2026.
Holding the mid-$70,000s keeps the structure cautiously bullish, but a slip below that range opens downside liquidity risk near $72,000. For context, BTC hit its all-time high of $126,080 on October 6, 2025, and currently sits roughly 39% below that peak.
Bitcoin ETFs recorded $1.26 billion in net outflows over the past week across six consecutive days of selling. That persistent institutional exit pressure, combined with BTC weekend trading in the $74,600 to $77,200 range, underscores how fragile the current equilibrium is. Rising BTC dominance at 60% signals that capital is rotating toward safety rather than flowing into altcoins broadly.
XRP tells a similar story of stalled momentum. At $1.34, down 1.10% in 24 hours, the token has faced repeated rejections near its 50-day moving average at $1.47. Lower highs forming beneath a declining trendline leave the structure leaning bearish until proven otherwise.
Critical horizontal support at $1.30 has held several times across March, April, and May. A breakdown below that level would likely accelerate selling. On the upside, the upcoming launch of CME 24/7 XRP futures on May 29 could inject fresh liquidity, and the U.S. Senate Banking Committee's advancement of the Digital Asset Market Clarity Act remains a longer-term institutional catalyst.
Shiba Inu and Hyperliquid: Where the Risk-Reward Is Playing Out
Shiba Inu trades at $0.0000055, down 1.12% over 24 hours, with a market cap of $3.24 billion. Sellers have dominated since a channel breakdown, and a cluster of moving average resistance between $0.0000060 and $0.00000630 caps any recovery attempts.
The RSI sits in the low 40s, weak but not yet oversold, which means there is room for further decline before technical bounce signals appear. A drop to $0.00000500 risks triggering a much greater structural decline. According to unconfirmed reports, roughly 86 billion SHIB tokens were removed from centralized exchanges in a recent 24-hour period, but that outflow has not translated into price strength.
Hyperliquid is the clear outlier. HYPE hit an all-time high of $64.27 on May 24 and trades at approximately $59.23 as of May 26, pulling back 3.52% in 24 hours. The weekly gain of 23.44% and 30-day gain of 43.41% are unmatched among major crypto assets.
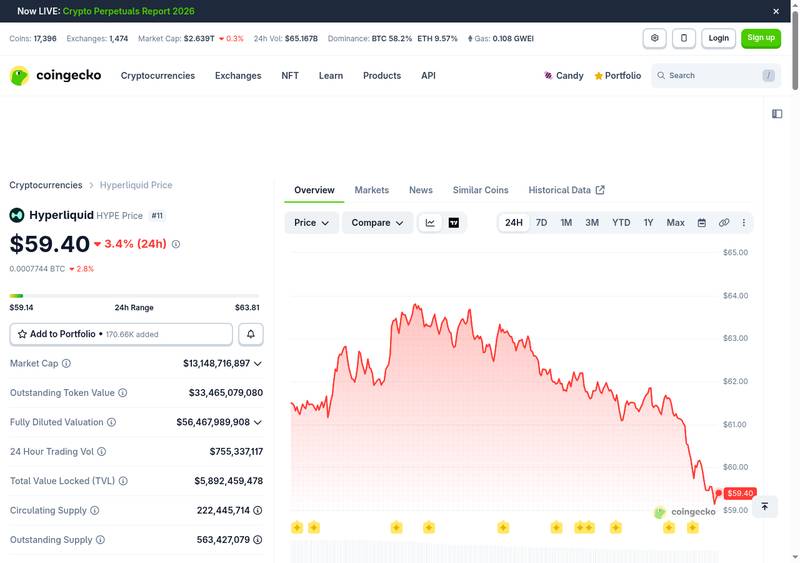
The near-vertical breakout pushed RSI far into overheated territory, and upper wicks on recent candles signal early profit-taking. HYPE's key breakout support zone sits at $55 to $57; as long as that range holds, the next psychological target remains around $70. With a market cap of $13.15 billion, HYPE has carved out a position as the high-conviction alpha story in a market where most altcoins are treading water.
The contrast is stark. SHIB is down roughly 1% on the week while HYPE is up 23%. In a fearful market, capital is not flowing evenly into risk assets; it is concentrating in specific narratives with momentum, exactly the dynamic the "risk brings profits" thesis describes.
What to Watch Next: Levels and Catalysts Across All Four Assets
For BTC, the $81,000 level at the 200-day MA is the line in the sand. A daily close above it would shift the 2026 trend structure from cautiously bullish to actively bullish. On the downside, $72,000 is where liquidity pools sit.
XRP needs to reclaim $1.47 to break the pattern of lower highs. Until it does, $1.30 support is the floor that matters. The CME XRP futures launch on May 29 could provide a near-term volatility catalyst.
SHIB bulls need to push above the $0.0000060 MA resistance cluster to invalidate the bearish structure. A failure to hold $0.00000500 would open the door to a deeper decline. Meanwhile, broader regulatory clarity in markets like Europe through MiCA licensing could eventually support meme-token legitimacy, but that remains a longer-term story.
HYPE traders should watch the $55 to $57 support zone closely. A bounce from that range on declining volume would suggest healthy consolidation; a break below it would signal the rally is exhausting. With RSI overheated, patience is warranted before chasing new entries.
Macro catalysts this week include U.S. GDP revisions and inflation data, both of which will shape broader risk appetite. The expansion of stablecoin infrastructure into new markets also signals growing institutional plumbing, even if sentiment remains cautious in the short term. In this environment, the trade is selective, not passive: risk does bring profits, but only for those choosing the right assets at the right levels.
Disclaimer: This article is for informational purposes only and does not constitute financial or investment advice. Cryptocurrency and digital asset markets carry significant risk. Always do your own research before making decisions.